XIRR vs CAGR vs Absolute Returns: what your statement hides
Why the 14% on your CAS statement is not the return you actually earned, what XIRR and CAGR really measure, and which one to use when you compare your portfolio to the Nifty.
In this guide
- 1Pull your transaction history, not just the current value. Absolute returns and CAGR both need two numbers: what you put in and what you got out. To compute either, you need every buy (SIP instalment, lumpsum, switch-in) and the current value of every lot.
- 2Compute absolute return per lot (the simple number, almost always misleading). Absolute return is the percentage change between what you paid and what you have today. For one lot, the formula is (current value - invested amount) / invested amount * 100. Multiply by 100 for a percentage. That is the number most apps show you at the top of the screen.
- 3Compute CAGR per lot (the time-adjusted number, but blind to cash flow timing). CAGR (Compound Annual Growth Rate) annualises absolute return over the holding period. Formula: CAGR = (current value / invested amount) ^ (1 / years) - 1. Multiply by 100 for a percentage.
- 4Compute XIRR (the only honest number for an SIP or any irregular cash flow). XIRR (Extended Internal Rate of Return) is the discount rate that makes the net present value of all your cash flows equal to zero. In plain English: it solves for the single annualised rate that, when applied to every cash flow on its actual date, reconciles what you put in with what you got out.
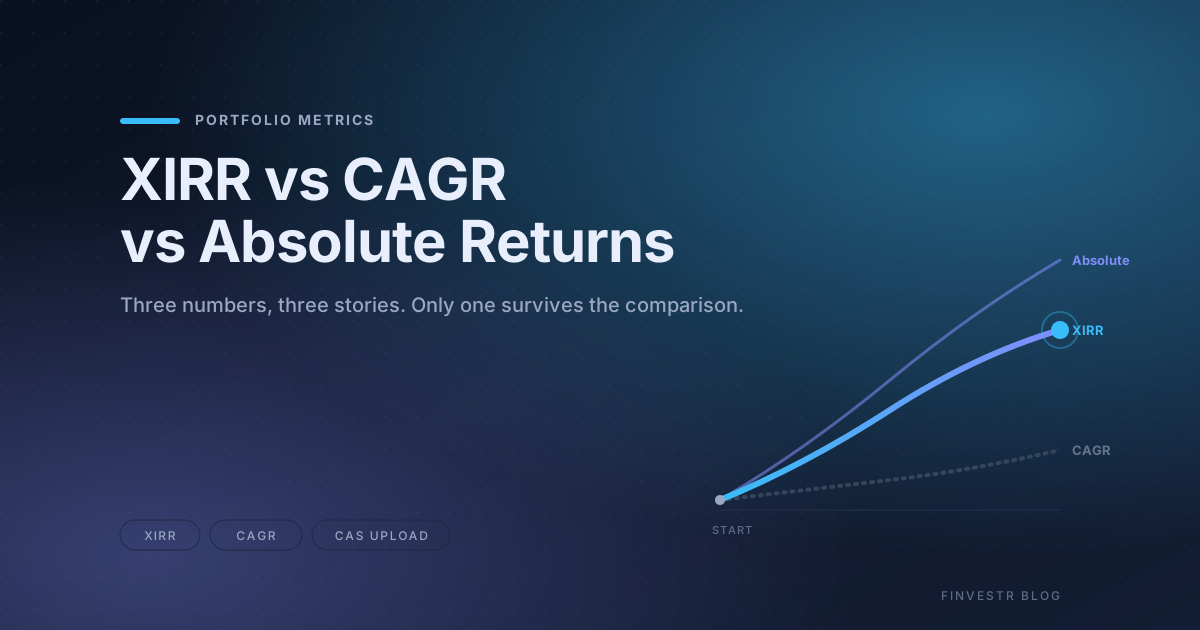
- 5Read the three numbers side by side. For the same SIP of ₹10,000/month for 3 years (₹3.6L invested), now worth ₹4.2L, the three numbers tell three different stories. Absolute return: 16.7%. CAGR: 5.3% per year. XIRR: 12.4% per year.
Your CAS statement says your mutual fund portfolio is up 14% over three years. Your Groww app says the same thing, but rounded to one decimal. Your friend, who has been running the same SIP, says his is up 18%. You compare the two and feel mildly annoyed.
All three of you are looking at the same number. None of you are looking at the right one.
The number at the top of every Indian portfolio app is absolute return. It is technically true and almost always misleading. The number most people should be looking at is XIRR. The number that sounds correct but is wrong for SIPs is CAGR. This post is the difference between the three, with the worked example your app will not show you.
The portfolio we will use as an example
To make this concrete, here is a real portfolio shape: an SIP of ₹10,000 per month for 3 years (April 2023 to March 2026), 36 instalments totalling ₹3.6L, into a flexi-cap fund. On 31 March 2026 the portfolio is worth ₹4.2L.
The three return numbers, side by side:
- Absolute return: +16.7% (the number your app shows)
- CAGR: +5.3% per year
- XIRR: +12.4% per year
The fact that three honest computations on the same data give three different numbers, with a spread of 11 percentage points, is the entire reason this post exists. Let me walk through how each one is calculated, and why only one of them is the answer to the question you are actually asking.
Absolute return: the headline number, and why it is wrong for an SIP
The formula is the simplest of the three:
> Absolute return = (current value − invested amount) ÷ invested amount × 100
For our example:
> (₹4,20,000 − ₹3,60,000) ÷ ₹3,60,000 × 100 = +16.7%
The intuition: you put in ₹3.6L, you have ₹4.2L, you are up ₹60,000, that is 16.7% of what you put in. This is the number the regulator requires AMCs to publish, which is why it is the number every app shows at the top of the screen.
The problem: this number assumes you put the entire ₹3.6L in on day one. You did not. Your first ₹10,000 was in the market for 36 months, but your last ₹10,000 was in the market for 1 month. Absolute return treats the full ₹3.6L as if it had been compounding for the full 3 years, which makes the headline look better than the truth.
It is not that absolute return is fake. It is that absolute return is the answer to a different question, the question "if I had put this exact amount in on day one, what would my return be?" For a single lumpsum held for 3 years, that is a real question and a real answer. For an SIP, it is the wrong question, because the cash flows are not what absolute return assumes they are.
CAGR: the time-adjusted number, still wrong for an SIP
CAGR fixes one of absolute return's two problems. It accounts for time. The formula:
> CAGR = (current value ÷ invested amount) ^ (1 ÷ years) − 1
For our example:
> (₹4,20,000 ÷ ₹3,60,000) ^ (1 ÷ 3) − 1 = 5.3% per year
The intuition: the 16.7% absolute return, spread out over 3 years, is the same as compounding 5.3% per year for 3 years. CAGR is the right number when you want to compare two investments held for different lengths of time. A lumpsum that grew 45% in 3 years and a lumpsum that grew 100% in 6 years are both around 13% CAGR, and CAGR is the apples-to-apples comparison.
The problem: CAGR still assumes you put the entire ₹3.6L in on day one. The first instalment of an SIP really has been compounding for 36 months, but the last instalment has been compounding for 1 month. CAGR averages this by pretending the full ₹3.6L was in for the full 3 years, which understates your actual return.
That is why CAGR on an SIP always looks too low. It is not that your SIP is doing badly. It is that CAGR is the wrong tool for the job.
XIRR: the only honest number for an SIP
XIRR (Extended Internal Rate of Return) is the discount rate that makes the net present value of all your cash flows equal to zero. In plain English: it solves for the single annualised rate that, when applied to every cash flow on its actual date, reconciles what you put in with what you got out.
The math, for the nerds:
> For every cash flow Ci at date Di and a final redemption at date Dn, XIRR finds r such that
> Σ Ci ÷ (1 + r) ^ ((Di − D0) ÷ 365) = 0
You do not have to solve this by hand. Excel has =XIRR(values, dates). Google Sheets has =XIRR(values, dates). The FinvestR-Agent computes it for every lot in your portfolio the moment you upload your CAS, per lot and at the portfolio level.
For our example:
> XIRR = +12.4% per year
The intuition: 12.4% is the single rate that, when applied to each of the 36 monthly ₹10,000 instalments on the date each was actually invested, reconciles to the final ₹4.2L portfolio value. It correctly weights the early instalments (which had more time to compound) and the late instalments (which had less).
The 12.4% number is the right answer to the question "how much am I making per year on the money I have actually had invested so far?" It is the only number that survives an apples-to-apples comparison with the Nifty 50, with another fund, or with your friend's portfolio.
A second example, with a lumpsum
To show where CAGR does work: a single lumpsum of ₹1,00,000 invested on 1 April 2023, now worth ₹1,45,000 on 31 March 2026.
- Absolute return: +45.0%
- CAGR: +13.0% per year
- XIRR: +13.0% per year
When the cash flow is a single point, CAGR and XIRR give the same answer. Absolute return gives the headline. For a single lumpsum, CAGR (or XIRR, which is the same thing) is the right number to use.
The divergence between CAGR and XIRR is a feature of having multiple cash flows. One cash flow in, one cash flow out: the two methods agree. Many cash flows in, one out: CAGR treats them as if they all happened on day one; XIRR weights them by their actual dates. For any SIP, STP, or series of switch-ins, the difference matters.
Why your app shows you the wrong number
Indian portfolio apps default to absolute return for one reason: the regulator requires it. SEBI's disclosure norms for AMCs mandate that factsheets show "absolute returns" for 1Y, 3Y, 5Y, 7Y, 10Y windows. That number is fine for a single lumpsum at the fund level, because the fund has one NAV in and one NAV out. It is misleading at the investor level, because the investor has 36 cash flows in and one portfolio value out.
The fix is not to blame the app. The fix is to know which number to look at. For an SIP, that number is XIRR. For a lumpsum, CAGR (which equals XIRR) is fine. For an SIP, the absolute return at the top of your screen is the least accurate of the three, and that is the one your app shows first.
A real comparison: your fund vs the Nifty, over the same dates
The single most useful thing XIRR enables is a fair comparison. The Nifty 50 is often quoted as "12.5% over 10 years", but that is a single-point number, it assumes you invested on the start date and held to the end. The right comparison for an SIP is the XIRR of a hypothetical SIP into the Nifty 50 over the exact same dates as your real SIP.
Concretely, if you ran an SIP of ₹10,000/month into a flexi-cap fund from April 2023 to March 2026, the comparison that matters is:
- Your portfolio XIRR: 12.4%
- Nifty 50 SIP over the same 36 dates: 11.8%
- Value added by the fund manager: 0.6 percentage points per year, after fees
That 0.6 is the alpha the fund manager generated, net of all costs. It is a real number, comparable across funds and across time. Without XIRR, you cannot compute it. The FinvestR-Agent does this exact comparison for every lot in your portfolio the moment you upload your CAS, with the appropriate benchmark index picked per fund category.
Which number should you actually use?
A simple rule:
- Single lumpsum, no other cash flows: CAGR (which equals XIRR) is the right number.
- SIP, STP, or any series of cash flows: XIRR. CAGR will understate. Absolute return will overstate.
- Comparing your portfolio to the Nifty: XIRR, over the same dates, in the same benchmark fund.
- Comparing two funds you are choosing between: their 5Y XIRR, computed with monthly SIPs starting on the same date. If one is 12.4% and the other is 12.1%, they are effectively the same fund.
The FinvestR-Agent computes all three numbers per lot, on the same page, so you can see when they agree (single lumpsum) and when they diverge (SIPs and irregular cash flows). The number that is the right answer to the question you are asking is almost always XIRR, and that is the one we surface at the top.
The takeaway
Your CAS statement, your Groww app, and your friend's app are not lying to you. They are all showing you absolute return, which is a real number that answers a different question.
The number you actually want is the one that accounts for when each rupee went in. That number is XIRR. For a 3-year SIP, XIRR can be 7-8 percentage points higher than CAGR and 4-5 points lower than absolute return, and that is the gap between the answer your app shows and the answer to the question you are actually asking.
If you want to see it for your own portfolio, upload your CAS at the FinvestR-Agent. Every lot gets a per-lot XIRR, the portfolio gets a portfolio-level XIRR, and each lot is benchmarked against the right Nifty index over the same dates. The whole point of the agent is to show you the number that survives the comparison, not the one that survives the headline.
What to read next
XIRR is one of three numbers on every FinvestR-Agent lot. The whole SIP setup that produces those cash flows is in How to start investing in mutual funds in India. The retirement corpus the XIRR is eventually feeding is in How much you actually need to retire in India. The pillar shortlist of funds to actually put those SIPs in is in Best mutual funds to invest in India 2026. And the monthly mutual fund rankings are the place to see which funds have a 5Y XIRR worth chasing.
Frequently asked questions
Which return number should I use to compare my portfolio to the Nifty?▾
XIRR, every time. The Nifty 50 return is a single-point comparison, but you built your portfolio with multiple cash flows at different times. CAGR compares the start and end values only, which is fine for a single lumpsum but wrong for an SIP. XIRR is the only one of the three that is honest about the timing and size of every cash flow. The FinvestR agent computes XIRR per lot and at the portfolio level, and compares it to the appropriate Nifty index over the same period.
Why does my CAS statement show a different return than my Groww/Zerodha app?▾
Different apps use different formulas. Most show absolute return at the top (the largest, most flattering number) and CAGR underneath it. A few show XIRR for SIPs. If you see only absolute return, you are looking at a feel-good number, not your actual annualised return. If you see only CAGR on an SIP, you are looking at a number that understates your real return. The fix: open the FinvestR-Agent, upload your CAS, and look at the per-lot XIRR. That is the number that survives every apples-to-apples comparison.
Is XIRR always lower than absolute return for an SIP?▾
Almost always. For an SIP that has been running in a flat or down market, absolute return can be misleadingly positive (because the early instalments are still in the money), but XIRR will show the true picture. The only case where XIRR exceeds absolute return is when the market has been falling recently and your early instalments are underwater while the late ones are flat. In that case XIRR can be lower, not higher. Either way, XIRR is the right number.
What is a good XIRR for an equity mutual fund portfolio?▾
Over a 5+ year window, a good XIRR is 11-13% (which is the long-run Nifty 50 return before inflation). Over a 10+ year window, anything above 11% is matching the index, anything above 13% is beating it. Anything above 15% sustained is genuinely impressive and rare. Anything below 9% over a 7+ year window is underperforming the index after fees, and the FinvestR agent will flag it.
Can I compute XIRR without a CAS upload?▾
Yes, but you need the data. Open your CAS (or download it from MFCentral, CAMSOnline, or Karvy). You need: every buy (date + amount) and the current value of every lot. Paste the two columns into Excel: =XIRR(values, dates). The function is in every modern spreadsheet. The FinvestR-Agent does this automatically the moment you upload your CAS, per lot and at the portfolio level.
Why does CAGR on an SIP always look bad?▾
Because CAGR assumes you put the entire amount in on day one. For an SIP of ₹10,000/month for 3 years, the first ₹10,000 was in the market for 36 months but the last ₹10,000 was in the market for 1 month. CAGR averages this by pretending the full ₹3.6L was in for 3 years, which drags the annualised number down. XIRR, by contrast, weighs each cash flow by the time it was actually deployed. If your CAGR on a 3-year SIP is in single digits, that does not mean the SIP is underperforming. It means CAGR is the wrong tool.
Does XIRR account for dividends?▾
Only if you include them as cash flows. A dividend paid out is a positive cash flow on the dividend date. A dividend reinvested is a buy on the dividend date at the reinvestment NAV. Most apps ignore this, which is why their XIRR is slightly off. The FinvestR-Agent includes every dividend and reinvestment in the cash flow list, so the per-lot XIRR it computes is the most accurate you will see without a SEBI-registered advisor's tools.
What about XIRR vs the rolling return of the Nifty over the same dates?▾
That is the right comparison. The FinvestR agent does this: for every lot in your portfolio, it computes the XIRR of an equivalent SIP into the Nifty 50 over the exact same dates, and shows you the difference. A portfolio XIRR of 12.4% against a same-dates Nifty XIRR of 11.8% means your fund manager added 0.6% of value per year after fees. That is a real number, comparable across funds and across time.
See your portfolio the way it should be seen.
Try the 1-min Goal CheckRelated reading
How to Read Your CAS Statement in India (2026 Guide)
A plain-English walkthrough of the Consolidated Account Statement: what each section means, how to read the valuation and XIRR numbers, the CAMS vs Kfintech difference, and how to spot overlapping funds and concentrated AMC exposure.
ELSS vs PPF: Which 80C option is better for you?
A plain-English comparison of the two most common 80C choices, with the lock-in, return, and risk trade-offs laid out side by side.
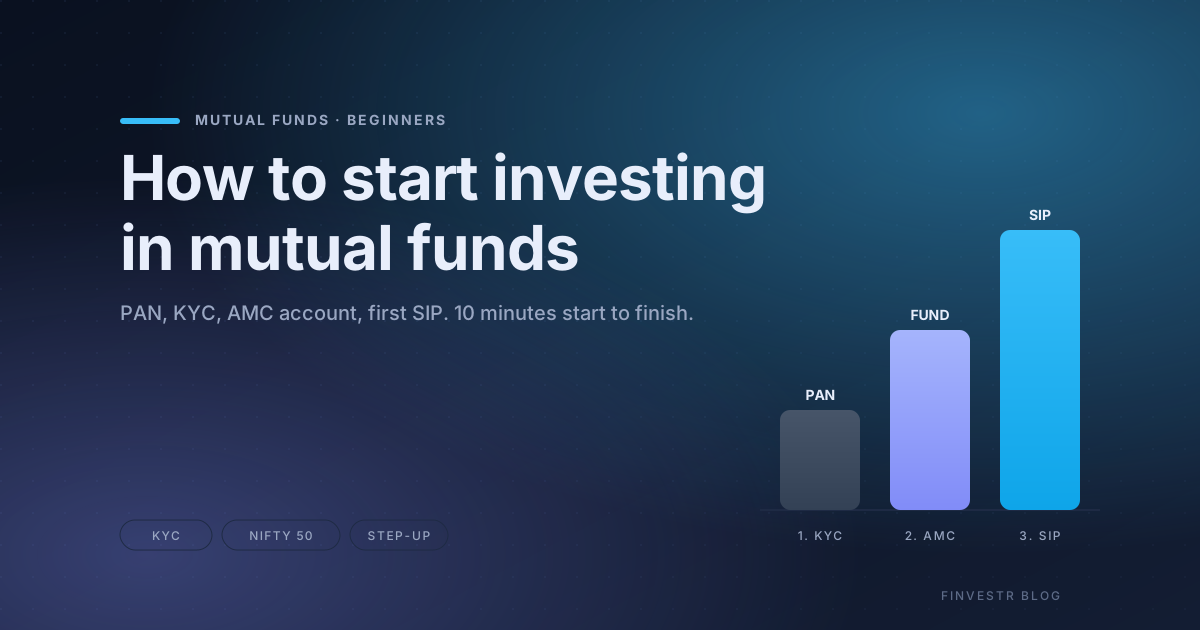
How to start investing in mutual funds in India (2026)
Everything you need to go from zero to your first SIP: KYC, PAN, picking an AMC, choosing a fund, automating the SIP, and the three funds most beginners actually need to start with.