Top mutual fund rankings: September 2026
Our September 2026 category-wise mutual fund rankings, with 3M, 1Y, 3Y, 5Y, Sharpe 3Y and a final score for every top-5 fund. Quant and LIC MF dominate the movers.
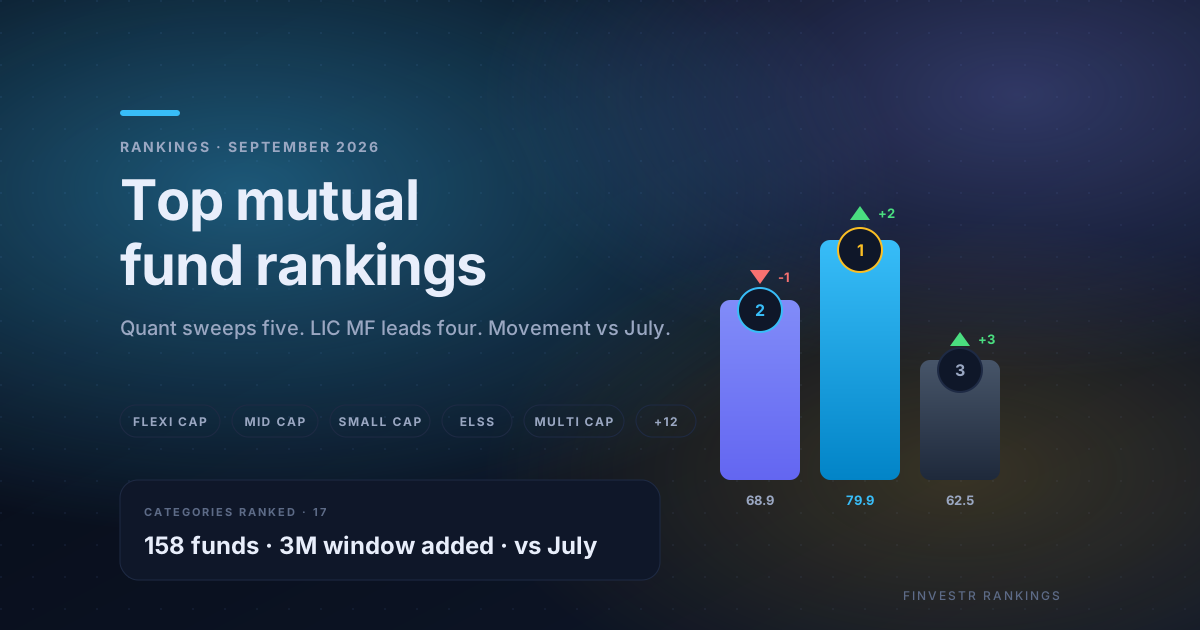
Welcome to the September 2026 edition. Below are our category-wise mutual fund rankings for Regular plans, computed from the AMFI NAV file and the AMC factsheets we track. The methodology, the score, and the inputs are all on the page. Read the methodology first, scan the categories that match your portfolio, then look at the live /rankings page for the full ranked list with movement and filters.
This is a snapshot. Rankings change every month. A fund at #1 in September can be at #3 in October. Use these lists to start research, not to lock in a decision.
One note before the tables: the August cycle was skipped in the data pipeline, so movement in this edition is measured against July. The September dataset is also the largest we have published, with 158 funds across 37 categories, up from 89 funds in July.
How the score is built
We score funds on four inputs:
- Annualised returns at 3M, 1Y, 3Y and 5Y, normalised 0 to 100 within each SEBI category and plan type. The 3M window is new this edition and is included so recent momentum is visible, but it carries the smallest weight.
- Sharpe ratio over 3Y, normalised 0 to 100. This is the risk-adjusted return. It penalises funds that got lucky on a single year.
- Maximum drawdown over 3Y, normalised 0 to 100 (inverted, so smaller drawdowns score higher). This is the worst peak-to-trough fall the fund has had. A fund with a 30% drawdown is not a comfortable core holding, even if its 5Y number is the best in the category.
- AUM and AMC continuity. We quietly downgrade funds that have had a sudden AUM shock, a fund-manager change, or a benchmark change in the last 6 months.
Each input gets a weight; we blend the windows with a bias towards long-term performance. The final score is 0 to 100. The top fund in each category sits at the top of its table; the rest follow.
The score is not a buy signal. It is a sorting signal. A fund that scores 90 in Mid Cap is not twice as good as one that scores 45. The 90 is a "look at this first", the 45 is a "skip unless you have a reason".
Regular plan rankings, category by category
Below: top 5 Regular plans in each SEBI category we track, for the period ending 31 Aug 2026. 3M, 1Y, 3Y and 5Y are annualised. Score is the final blended score from the methodology.
Aggressive Hybrid
| Rank | Scheme | Fund House | 3M | 1Y | 3Y | 5Y | Score |
|---|---|---|---|---|---|---|---|
| 1 | Quant Aggressive Hybrid Fund | quant Mutual Fund | 1.52% | 11.43% | 11.95% | 11.59% | 79.88 |
| 2 | Edelweiss Aggressive Hybrid Fund | Edelweiss Mutual Fund | 5.02% | 3.60% | 12.26% | 11.82% | 59.60 |
| 3 | LIC MF Aggressive Hybrid Fund | LIC Mutual Fund | 6.70% | 3.97% | 10.47% | 7.93% | 51.09 |
| 4 | UTI Aggressive Hybrid Fund | UTI Mutual Fund | 4.17% | 2.18% | 10.58% | 10.74% | 45.28 |
| 5 | Baroda BNP Paribas Aggressive Hybrid Fund | Baroda BNP Paribas Mutual Fund | 4.03% | 1.95% | 10.20% | — | 28.83 |
Arbitrage
| Rank | Scheme | Fund House | 3M | 1Y | 3Y | 5Y | Score |
|---|---|---|---|---|---|---|---|
| 1 | Kotak Arbitrage Fund | Kotak Mahindra Mutual Fund | 1.34% | 5.84% | 6.86% | 6.26% | 87.04 |
| 2 | HDFC Arbitrage Fund | HDFC Mutual Fund | 1.26% | 5.75% | 6.73% | 6.04% | 66.21 |
| 3 | Aditya Birla Sun Life Arbitrage Fund | Aditya Birla Sun Life Mutual Fund | 1.31% | 5.71% | 6.68% | 6.00% | 59.63 |
| 4 | Nippon India Arbitrage Fund | Nippon India Mutual Fund | 1.29% | 5.73% | 6.59% | 5.98% | 55.46 |
| 5 | Bandhan Arbitrage Fund | Bandhan Mutual Fund | 1.21% | 5.45% | 6.55% | 5.93% | 29.98 |
Balanced Advantage
| Rank | Scheme | Fund House | 3M | 1Y | 3Y | 5Y | Score |
|---|---|---|---|---|---|---|---|
| 1 | ICICI Prudential Balanced Advantage Fund | ICICI Prudential Mutual Fund | 5.87% | 5.81% | 11.19% | 10.49% | 65.68 |
| 2 | Edelweiss Balanced Advantage Fund | Edelweiss Mutual Fund | 5.30% | 5.97% | 9.86% | 8.40% | 53.94 |
| 3 | HDFC Balanced Advantage Fund | HDFC Mutual Fund | 4.04% | 2.05% | 11.55% | 14.40% | 53.56 |
| 4 | quant Dynamic Asset Allocation Fund | quant Mutual Fund | -0.16% | 0.51% | 12.25% | — | 38.23 |
| 5 | UTI - Unit Linked Insurance Plan | UTI Mutual Fund | 5.81% | 2.47% | 7.47% | 5.93% | 18.49 |
Conservative Hybrid
| Rank | Scheme | Fund House | 3M | 1Y | 3Y | 5Y | Score |
|---|---|---|---|---|---|---|---|
| 1 | Nippon India Conservative Hybrid Fund | Nippon India Mutual Fund | 2.50% | 6.88% | 8.06% | 7.56% | 70.70 |
| 2 | SBI Conservative Hybrid Fund | SBI Mutual Fund | 2.26% | 5.63% | 8.13% | 8.24% | 68.19 |
| 3 | Bandhan Conservative Hybrid Fund | Bandhan Mutual Fund | 3.06% | 3.37% | 6.52% | 4.91% | 54.61 |
| 4 | Franklin India Conservative Hybrid Fund | Franklin Templeton Mutual Fund | 2.52% | 2.53% | 7.32% | 6.55% | 51.29 |
| 5 | Baroda BNP Paribas Conservative Hybrid Fund | Baroda BNP Paribas Mutual Fund | 2.08% | 4.43% | 7.12% | — | 41.87 |
Contra Fund
| Rank | Scheme | Fund House | 3M | 1Y | 3Y | 5Y | Score |
|---|---|---|---|---|---|---|---|
| 1 | Kotak Contra Fund | Kotak Mahindra Mutual Fund | 5.56% | 3.14% | 14.62% | 13.28% | 85.00 |
| 2 | SBI Contra Fund | SBI Mutual Fund | 3.49% | -0.37% | 10.70% | 14.96% | 15.00 |
Dividend Yield
| Rank | Scheme | Fund House | 3M | 1Y | 3Y | 5Y | Score |
|---|---|---|---|---|---|---|---|
| 1 | LIC MF Dividend Yield Fund | LIC Mutual Fund | 7.21% | 8.16% | 17.84% | — | 78.11 |
| 2 | Aditya Birla Sun Life Dividend Yield Fund | Aditya Birla Sun Life Mutual Fund | 3.50% | 4.99% | 12.30% | 12.98% | 58.93 |
| 3 | SBI Dividend Yield Fund | SBI Mutual Fund | 6.29% | 5.10% | 11.00% | — | 37.72 |
| 4 | Franklin India Dividend Yield Fund | Franklin Templeton Mutual Fund | 1.13% | 0.50% | 10.95% | 12.03% | 20.45 |
| 5 | Sundaram Dividend Yield Fund | Sundaram Mutual Fund | 1.69% | -2.00% | 9.10% | — | 8.14 |
ELSS
| Rank | Scheme | Fund House | 3M | 1Y | 3Y | 5Y | Score |
|---|---|---|---|---|---|---|---|
| 1 | Quant ELSS Tax Saver Fund | quant Mutual Fund | 5.07% | 15.20% | 13.92% | 14.19% | 77.80 |
| 2 | Baroda BNP Paribas ELSS Tax Saver Fund | Baroda BNP Paribas Mutual Fund | 7.36% | 6.32% | 14.60% | — | 48.72 |
| 3 | SBI ELSS Tax Saver Fund | SBI Mutual Fund | 2.75% | -0.77% | 14.02% | 14.46% | 48.31 |
| 4 | Kotak ELSS Tax Saver Fund | Kotak Mahindra Mutual Fund | 7.44% | 2.84% | 10.45% | 10.79% | 45.10 |
| 5 | Union ELSS Tax Saver Fund | Union Mutual Fund | 7.49% | 1.69% | 10.23% | 9.85% | 40.79 |
Equity Savings
| Rank | Scheme | Fund House | 3M | 1Y | 3Y | 5Y | Score |
|---|---|---|---|---|---|---|---|
| 1 | HDFC Equity Savings Fund | HDFC Mutual Fund | 2.78% | 3.14% | 7.65% | 7.59% | 71.21 |
| 2 | LIC MF Equity Savings Fund | LIC Mutual Fund | 2.88% | 2.99% | 7.84% | — | 50.30 |
| 3 | Bandhan Equity Savings Fund | Bandhan Mutual Fund | 2.00% | 3.49% | 6.31% | 5.72% | 30.21 |
Flexi Cap
| Rank | Scheme | Fund House | 3M | 1Y | 3Y | 5Y | Score |
|---|---|---|---|---|---|---|---|
| 1 | Quant Flexi Cap Fund | quant Mutual Fund | 2.35% | 15.02% | 14.34% | 13.64% | 68.85 |
| 2 | ITI Flexi Cap Fund | ITI Mutual Fund | 11.46% | 14.12% | 16.85% | — | 63.75 |
| 3 | Aditya Birla Sun Life Flexi Cap Fund | Aditya Birla Sun Life Mutual Fund | 8.50% | 10.69% | 14.75% | 11.32% | 59.27 |
| 4 | LIC MF Flexi Cap Fund | LIC Mutual Fund | 13.28% | 8.21% | 11.30% | 9.89% | 57.77 |
| 5 | HDFC Flexi Cap Fund | HDFC Mutual Fund | 7.84% | 3.56% | 15.65% | 17.12% | 53.97 |
Focused Fund
| Rank | Scheme | Fund House | 3M | 1Y | 3Y | 5Y | Score |
|---|---|---|---|---|---|---|---|
| 1 | Quant Focused Fund | quant Mutual Fund | 4.85% | 11.36% | 11.99% | 11.97% | 62.48 |
| 2 | SBI Focused Fund | SBI Mutual Fund | 7.00% | 13.68% | 15.57% | 11.63% | 61.73 |
| 3 | ITI Focused Fund | ITI Mutual Fund | 5.90% | 11.96% | 17.30% | — | 57.14 |
| 4 | HDFC Focused Fund | HDFC Mutual Fund | 7.19% | 1.03% | 14.98% | 17.35% | 53.19 |
| 5 | Bandhan Focused Fund | Bandhan Mutual Fund | 6.62% | 5.00% | 14.46% | 11.14% | 50.69 |
Large & Mid Cap
| Rank | Scheme | Fund House | 3M | 1Y | 3Y | 5Y | Score |
|---|---|---|---|---|---|---|---|
| 1 | Quant Large & Mid Cap Fund | quant Mutual Fund | 3.59% | 12.60% | 13.67% | 14.42% | 71.94 |
| 2 | Sundaram Large and Midcap Fund | Sundaram Mutual Fund | 12.99% | 10.77% | 14.16% | 11.41% | 66.31 |
| 3 | Bandhan Large & Mid Cap Fund | Bandhan Mutual Fund | 5.37% | 6.35% | 17.31% | 15.84% | 65.19 |
| 4 | Bank of India Large & Mid Cap Fund | Bank of India Mutual Fund | 7.67% | 9.68% | 13.95% | 11.92% | 59.53 |
| 5 | ICICI Prudential Large & Mid Cap Fund | ICICI Prudential Mutual Fund | 7.51% | 4.71% | 15.41% | 16.14% | 58.54 |
Large Cap
| Rank | Scheme | Fund House | 3M | 1Y | 3Y | 5Y | Score |
|---|---|---|---|---|---|---|---|
| 1 | Taurus Large Cap Fund | Taurus Mutual Fund | 12.33% | 8.93% | 13.37% | 10.45% | 78.80 |
| 2 | Bandhan Large Cap Fund | Bandhan Mutual Fund | 7.20% | 2.85% | 12.49% | 9.67% | 62.38 |
| 3 | quant Large Cap Fund | quant Mutual Fund | 3.32% | 7.68% | 12.14% | — | 60.89 |
| 4 | Tata Large Cap Fund | Tata Mutual Fund | 4.67% | 2.44% | 10.11% | 9.00% | 45.24 |
| 5 | HDFC Large Cap Fund | HDFC Mutual Fund | 6.34% | 0.09% | 9.64% | 11.04% | 42.34 |
Mid Cap
| Rank | Scheme | Fund House | 3M | 1Y | 3Y | 5Y | Score |
|---|---|---|---|---|---|---|---|
| 1 | HDFC Mid Cap Fund | HDFC Mutual Fund | 7.46% | 10.03% | 17.36% | 18.90% | 66.40 |
| 2 | Sundaram Mid Cap Fund | Sundaram Mutual Fund | 7.22% | 9.08% | 18.19% | 16.43% | 62.07 |
| 3 | Aditya Birla Sun Life Midcap Fund | Aditya Birla Sun Life Mutual Fund | 8.36% | 10.44% | 14.88% | 13.84% | 56.24 |
| 4 | Baroda BNP Paribas Mid Cap Fund | Baroda BNP Paribas Mutual Fund | 6.04% | 11.57% | 15.94% | — | 51.23 |
| 5 | LIC MF Mid Cap Fund | LIC Mutual Fund | 8.65% | 9.50% | 15.73% | — | 47.74 |
Multi Cap
| Rank | Scheme | Fund House | 3M | 1Y | 3Y | 5Y | Score |
|---|---|---|---|---|---|---|---|
| 1 | LIC MF Multi Cap Fund | LIC Mutual Fund | 9.90% | 11.05% | 16.60% | — | 61.73 |
| 2 | Bank of India Multi Cap Fund | Bank of India Mutual Fund | 8.63% | 14.16% | 16.84% | — | 60.02 |
| 3 | Union Multicap Fund | Union Mutual Fund | 10.01% | 12.26% | 14.11% | — | 52.02 |
| 4 | Baroda BNP Paribas Multi Cap Fund | Baroda BNP Paribas Mutual Fund | 6.26% | 4.24% | 13.98% | 12.55% | 40.98 |
| 5 | Quant Multi Cap Fund | quant Mutual Fund | 5.07% | 8.97% | 8.68% | 10.69% | 40.69 |
Sectoral/Thematic
| Rank | Scheme | Fund House | 3M | 1Y | 3Y | 5Y | Score |
|---|---|---|---|---|---|---|---|
| 1 | LIC MF Infrastructure Fund | LIC Mutual Fund | 5.45% | 13.56% | 22.53% | 20.69% | 66.95 |
| 2 | Bank of India Manufacturing & Infrastructure Fund | Bank of India Mutual Fund | 7.26% | 19.23% | 20.48% | 19.68% | 65.22 |
| 3 | Franklin Asian Equity Fund | Franklin Templeton Mutual Fund | 4.20% | 42.04% | 21.72% | 8.05% | 65.21 |
| 4 | Quant Infrastructure Fund | quant Mutual Fund | 4.55% | 15.16% | 16.55% | 17.40% | 63.82 |
| 5 | SBI Healthcare Opportunities Fund | SBI Mutual Fund | 11.56% | 20.07% | 23.02% | 17.10% | 62.91 |
Small Cap
| Rank | Scheme | Fund House | 3M | 1Y | 3Y | 5Y | Score |
|---|---|---|---|---|---|---|---|
| 1 | LIC MF Small Cap Fund | LIC Mutual Fund | 15.02% | 18.70% | 17.62% | — | 74.98 |
| 2 | Quant Small Cap Fund | quant Mutual Fund | 11.41% | 17.00% | 16.69% | 18.77% | 73.84 |
| 3 | DSP Small Cap Fund | DSP Mutual Fund | 13.42% | 18.64% | 16.47% | 18.09% | 66.68 |
| 4 | Aditya Birla Sun Life Small Cap Fund | Aditya Birla Sun Life Mutual Fund | 12.94% | 20.72% | 14.66% | 13.46% | 63.96 |
| 5 | Sundaram Small Cap Fund | Sundaram Mutual Fund | 10.48% | 17.02% | 16.22% | 16.39% | 63.02 |
Value Fund
| Rank | Scheme | Fund House | 3M | 1Y | 3Y | 5Y | Score |
|---|---|---|---|---|---|---|---|
| 1 | Aditya Birla Sun Life Value Fund | Aditya Birla Sun Life Mutual Fund | 7.78% | 15.82% | 14.27% | 13.97% | 72.89 |
| 2 | LIC MF Value Fund | LIC Mutual Fund | 11.82% | 22.40% | 16.32% | — | 68.30 |
| 3 | HDFC Value Fund | HDFC Mutual Fund | 8.68% | 9.05% | 15.73% | 13.42% | 68.21 |
| 4 | Tata Value Fund | Tata Mutual Fund | 6.78% | 4.15% | 12.65% | 12.92% | 53.07 |
| 5 | Nippon India Value Fund | Nippon India Mutual Fund | 3.84% | 0.45% | 14.07% | 13.42% | 51.96 |
What moved since July
Two stories dominate this edition, and they are both AMC-level stories rather than single-fund stories.
The Quant sweep. Quant AMC holds the #1 spot in five categories: Flexi Cap (up 2 places to #1, score 68.85), ELSS (77.80), Focused Fund (up 3 to #1, 62.48), Aggressive Hybrid (79.88) and Large & Mid Cap (up 3 to #1, 71.94). That is not five independent fund managers getting lucky in the same month. It is a single investment style, momentum-tilted and concentrated, working across the book at once. The same style that lifts all five tables in a strong month can drag all five down in a rotation, which is exactly the AMC-concentration question every investor holding two or more Quant funds should ask. The FinvestR agent's AMC-exposure check flags this in your own portfolio.
The LIC MF comeback. LIC Mutual Fund leads four categories: Small Cap (74.98, a new #1), Multi Cap (up 4 places to #1, 61.73), Dividend Yield (78.11) and Infrastructure (66.95, up 1). It also sits #2 in Value and Equity Savings. The caveat is visible in the tables: most of these leaders have no 5Y column, so their scores are built on 3M, 1Y and 3Y alone. A strong recent record is not a proven long-cycle record. Watchlist, not conclusion.
Other notable moves:
- Large Cap: Taurus Large Cap took #1 (78.80), with Bandhan Large Cap up 2 and quant Large Cap down 1. The 16-point gap between #1 and #2 is the widest in any category this month.
- Value Fund: Aditya Birla Sun Life Value moved up 2 to #1 (72.89), displacing LIC MF Value to #2.
- Arbitrage: Kotak Arbitrage took #1 (87.04) from HDFC, the highest score in the entire September dataset.
- Contra Fund: Kotak Contra holds #1 (85.00) with SBI Contra up 1. The category has only two funds with clean data this period.
- Balanced Advantage: ICICI Prudential holds #1 (65.68) with Edelweiss up 2. One data quirk: a UTI unit-linked insurance plan appears at #5 in the raw feed; we have kept it in the table for transparency but it is not a mutual fund and should be ignored for selection purposes.
- Mid Cap: HDFC Mid Cap took #1 (66.40) with Sundaram close behind at 62.07.
The full movement deltas (up/down arrows with rank change) are on the live /rankings page, category by category.
How to use this list
The first question most readers ask is "which fund should I buy". The honest answer is: this list is a starting point, not a finishing point. A few rules of thumb that we use ourselves when looking at a fresh list:
- Start with your goals, not with the ranking. If you are building a 20-year retirement SIP, the categories that matter are Flexi Cap, Mid Cap, Index funds, and a small-cap allocation. If you are looking at a 3-year ELSS allocation for Section 80C, the ELSS table is the table. The ranking helps you choose within the category, not the category itself.
- Watch the AMC concentration. This month is the clearest example yet: five Quant funds at #1 means a portfolio holding several of them is one style bet, not five diversified bets. The FinvestR agent reads your CAS and flags AMC-level exposure in plain English.
- Look past the headline number. A 1Y return of 42% in Sectoral/Thematic (Franklin Asian Equity) is exciting; a 3Y of 21.72% and a 5Y of 8.05% is the real story. The score is built to reward that. If a fund's 1Y is much higher than its 3Y, the fund has had a single good year. It is a yellow flag, not a red one.
- Size matters at the category level. A category leader with ₹500 Cr AUM is not the same as a category leader with ₹50,000 Cr AUM. Small funds can move faster; large funds are more stable. Both are fine in their place.
Methodology notes and caveats
Past performance is not indicative of future returns. The score is a research tool, not investment advice. We do not have a SEBI-registered investment advisor licence (we are a Mutual Fund Distributor, ARN-142502). For personalised advice, talk to a SEBI-registered investment advisor.
- Data source: AMFI NAV file and the AMC factsheets that the FinvestR data pipeline ingests nightly. The cut-off is the last business day of the previous month.
- Direct vs Regular: Tables in this post are Regular plans. The /rankings page supports Direct plans for users with that flag enabled on their account.
- Score window: 3M, 1Y, 3Y, 5Y, with weights biased to long-term. Sharpe 3Y and max-drawdown 3Y are blended in. The 3M window is new this edition and carries the smallest weight.
- August skip: the August cycle was skipped in the data pipeline, so movement is measured against July. The methodology is unchanged.
- Categories that don't fit the data window: Some categories have fewer than 5 funds with a clean 5Y record. Those rows show "—" rather than an extrapolated number. The Contra Fund category has only two funds with clean data this period.
- Updates: We refresh the score monthly. The post title is the month the data covers; the post date is the publish date. The live /rankings page always shows the most recent month.
What's next on the agent
If you have a CAS PDF, the FinvestR agent reads it, scores your existing funds against this same methodology, and tells you in your numbers which of your holdings sit near the top of their category, which are drifting, and which overlap each other. This month, the agent's AMC-exposure check is the one to run first: if you hold two or more Quant funds, or two or more LIC MF funds, the September tables are telling you exactly why that matters. The agent is free for Indian investors. Try the 1-min Goal Check to start, or open the live rankings to filter by category and period.
What to read next
The rankings are a starting point, not a finishing point. The full beginner's flow, KYC, AMC account, first SIP, is in How to start investing in mutual funds in India. The retirement goal the rankings eventually feed is sized in How much you actually need to retire in India. And before you buy a single fund, see ELSS vs PPF for the 80C trade-off. If you are unsure whether your existing portfolio is too spread out, check Is your mutual fund portfolio over-diversified?.
---
FinvestR is an AMFI-registered Mutual Fund Distributor (ARN-142502). The platform provides research and educational tools and does not provide personalised investment advice. Mutual fund investments are subject to market risks. Please read all scheme-related documents carefully before investing. Past performance is not indicative of future returns.
Frequently asked questions
How is the FinvestR mutual fund ranking score calculated?▾
A weighted blend of 3M, 1Y, 3Y and 5Y returns, normalised 0 to 100 within each SEBI category and plan type. Long-term periods carry more weight. Sharpe 3Y and max-drawdown 3Y are blended in to penalise funds that look good on returns alone.
Why was there no August 2026 rankings post?▾
The August cycle was skipped in the data pipeline, so the September edition measures movement against July instead of August. The live /rankings page always shows the most recent period with full data, and the score methodology is unchanged.
Are these Direct or Regular plan rankings?▾
The tables in this post are Regular plans. We are a SEBI-registered Mutual Fund Distributor (ARN-142502), and our active book is Regular. If you want Direct plans, the live /rankings page surfaces them for users who have Direct funds enabled on their account.
Why do several LIC MF funds top their categories without a 5Y record?▾
The score blends 3M, 1Y and 3Y when 5Y data does not exist yet, which lets newer funds rank on the windows they have. A leader without a 5Y column is a newer fund with a strong recent record, not a proven long-cycle winner. Treat those as watchlist entries, not conclusions.
Should I just buy the #1 fund in each category?▾
Not necessarily. A single category of funds is not a portfolio. Use the rankings as a starting list, then check overlap, AUM, expense ratio and the AMC. The FinvestR agent reads your CAS and flags if you already hold a top-ranked fund, or if two top-ranked funds overlap heavily.
See your portfolio the way it should be seen.
Try the 1-min Goal CheckRelated reading
Top mutual fund rankings: August 2026
Our August 2026 category-wise mutual fund rankings, with 1Y, 3Y, 5Y, Sharpe 3Y and a final score for every top-5 fund. Methodology on the page.
Top mutual fund rankings: July 2026
Our July 2026 category-wise mutual fund rankings, with 1Y, 3Y, 5Y, Sharpe 3Y and a final score for every top-5 fund. Methodology on the page.
Best mutual funds and index funds to invest in India (2026)
The 2026 shortlist across every category that matters for an Indian investor: large cap, flexi cap, mid cap, small cap, ELSS, index, debt, liquid. With the score, the rationale, and the live rankings link for each.